There are no items in your cart
Add More
Add More
| Item Details | Price | ||
|---|---|---|---|

Thu Jun 8, 2023
Introduction: In today's data-driven world, organizations are constantly seeking ways to harness the power of their data to gain a competitive edge. Microsoft Power BI, a robust business intelligence and data visualization tool, has emerged as a game-changer in this space. With its intuitive interface, powerful analytics capabilities, and seamless integration with other Microsoft products, Power BI empowers users to transform raw data into actionable insights. In this blog, we will delve into the key features and benefits of Microsoft Power BI, explore its applications across industries, and discuss how it can revolutionize the way businesses analyze and make decisions based on data.
Introducing Microsoft Power BI: Microsoft Power BI is a cloud-based business analytics service that enables users to connect to a wide range of data sources, transform raw data into meaningful visualizations, and share insights across the organization. Whether you're a data analyst, business user, or executive, Power BI provides a user-friendly and comprehensive platform for data exploration, analysis, and reporting.
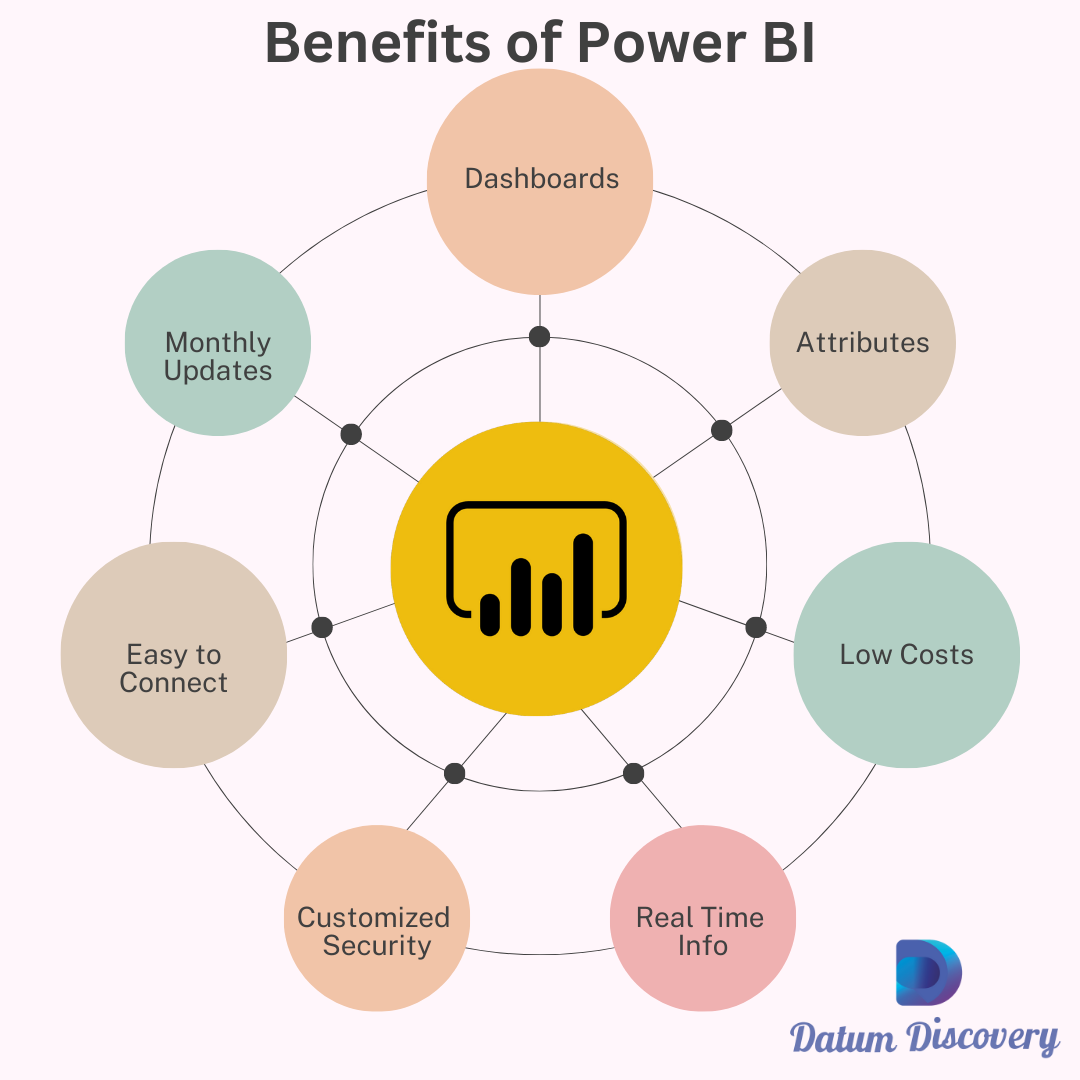
Key Features and Benefits:
a. Data Connectivity: Power BI offers seamless integration with various data sources, including Excel spreadsheets, SQL databases, cloud services like Azure and SharePoint, and popular third-party applications. This enables users to connect to their data with ease and pull real-time or scheduled data updates.
b. Interactive Visualizations: With an extensive library of customizable visuals, Power BI allows users to create interactive dashboards and reports that bring data to life. From charts and graphs to maps and tables, the visualizations can be tailored to suit specific business requirements, enabling users to uncover trends, patterns, and insights at a glance.
c. Advanced Analytics: Power BI goes beyond basic reporting and visualization by incorporating advanced analytics capabilities. It offers a rich set of data modeling tools, including the powerful DAX (Data Analysis Expressions) formula language, which allows users to create complex calculations, measures, and aggregations. Additionally, Power BI supports integration with Azure Machine Learning, enabling predictive analytics and machine learning capabilities.
d. Collaboration and Sharing: Power BI enables users to collaborate and share insights within their organization effortlessly. Teams can work together on dashboards and reports, share content securely with specific individuals or groups, and publish reports to the Power BI service or SharePoint for wider distribution.
e. Mobile and Cloud Accessibility: Power BI offers mobile apps for iOS and Android devices, allowing users to access their dashboards and reports on the go. The cloud-based nature of Power BI ensures that users can access their data and insights from anywhere, anytime, with automatic data refreshes.
Applications across Industries:
a. Retail: Power BI helps retailers analyze sales data, track inventory, and optimize pricing strategies. It enables retailers to gain real-time visibility into store performance, customer behavior, and supply chain analytics, leading to improved decision-making and enhanced customer experiences.
b. Healthcare: In the healthcare sector, Power BI facilitates data-driven decision-making, clinical analytics, and operational efficiency. It can consolidate data from various sources such as electronic health records, patient satisfaction surveys, and financial systems to identify patterns, track key performance indicators, and improve patient outcomes.
c. Finance: Power BI empowers finance teams to gain insights into financial performance, budgeting, forecasting, and risk management. It provides real-time dashboards and reports that enable financial analysts to monitor revenue, expenses, cash flow, and financial KPIs, enabling proactive decision-making and strategic planning.
d. Manufacturing: Power BI aids manufacturers in monitoring production efficiency, quality control, and supply chain optimization. By visualizing data from IoT devices, sensors, and production systems, manufacturers can identify bottlenecks, predict maintenance needs, and streamline operations to improve overall productivity and reduce costs.

Nirmal Pant
Founder at Datum Discovery || Corporate Trainer & Mentor @ Power BI, Tableau, SQL , Data & Business Analytics, Business Intelligence, Data Science || IIM Calcutta
 Launch your Graphy